Over the last couple of months, I had the chance to study pediatric reference curves such as growth charts. As a result of my research, I developed RefCurv, an easy-to-use tool to construct reference curves. Here a short description.
Most people know the reference curves for the Body Mass Index (BMI). These curves serve as tool to classify whether you are obese or skinny. The different curves represent the “percentiles” of a distribution. In other words, the curve tells you what percentage of people have a higher or lower value (such as BMI) than you. If you are on the 75th percentile (or close), 75% of people have a lower BMI. To construct these curves, a model has to be fitted to measured data points, which can be considered as normal.
Let us take a look at an example.
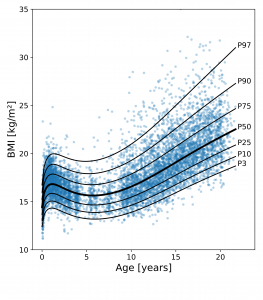
The figure shows example reference curves for Body Mass Index (BMI) over age. The curves are based on a dataset of healthy Dutch boys. RefCurv was used to fit a model to the data points and depict it in the form of percentile curves. The labels indicate the percentiles, e.g. “P3” stands for the third percentile.
How does RefCurv work?
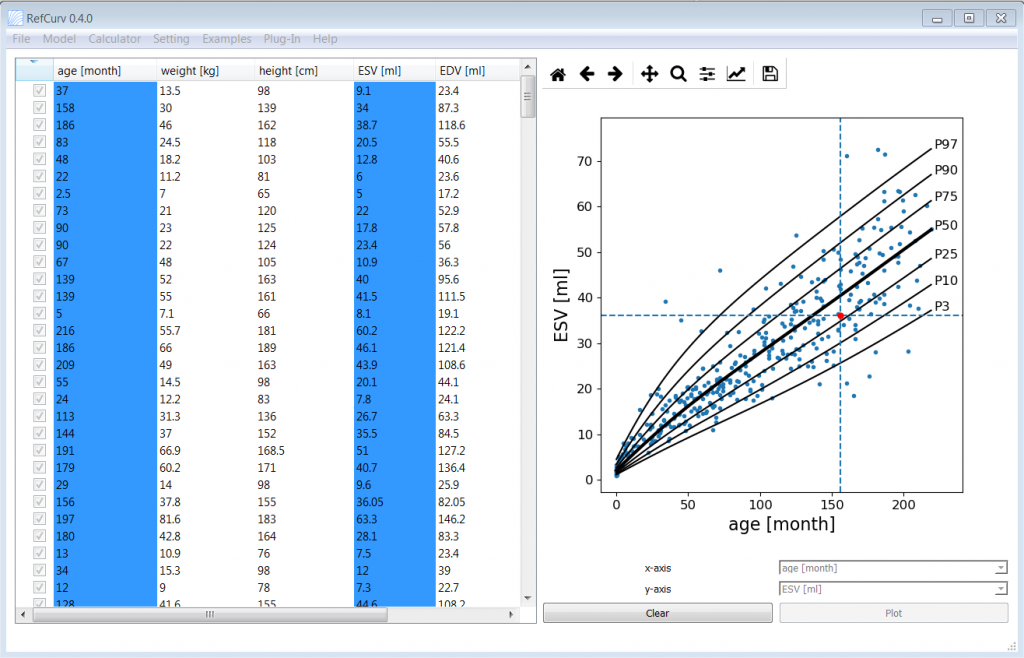
The graphical user interface (GUI) is written in Python. RefCurv uses R and the GAMLSS add-on package as the underlying statistical engine.
As a user, you can load your data into RefCurv and analyze them in a scatter plot. You can select and deselect data points that should be considered for the reference curves. In some easy steps, you can fit a model to the data and plot the results as percentile curves.
RefCurv version 0.4.1 has just been released and was tested for Windows. You can download the binary from the GitHub repository: https://github.com/xi2pi/RefCurv/releases/tag/v0.4.1-zip
Find more information such as a quick guide in the repository: https://github.com/xi2pi/RefCurv
If you want to know more about the statistical method, you can find more information on the website of the GAMLSS developers (gamlss.com).
Any feedback is highly appreciated!